Model lean: Spain 41%. Most likely score path: 1-1.
- Match status: Today
- Argentina 31%
- Draw 28%
- Spain 41%
- Predicted score 1-1
- Market odds 100%
- Official odds pending
AI forecast analytics for the 2026 World Cup, covering pre-match probabilities, scoreline projections, group standings, and visual post-match review.
This dashboard provides 2026 World Cup predictions, including pre-match win/draw/loss probabilities, AI score prediction, goal-total forecasts, group standings, completed-result backtesting, player lineups, and visual charts.
All outputs are model-assisted analysis for research, viewing context, and post-match review. They do not guarantee results and are not betting advice.
Final-stage focus
New multi-angle pages for Argentina vs Spain and England vs France: winner probability, score/xG, odds status, lineups and tactical reads.
Model lean: Spain 41%. Most likely score path: 1-1.
Model lean: England 36%. Most likely score path: 1-1.
Final
Argentina vs Spain World Cup final main forecast Includes AI probability, score 1-1, xG 1.07-1.29, odds status and lineup context.
Third place
England vs France Third-place match main forecast Includes AI probability, score 1-1, xG 1.18-1.18, odds status and lineup context.
Final
Argentina vs Spain World Cup final winner probability Includes AI probability, score 1-1, xG 1.07-1.29, odds status and lineup context.
Third place
England vs France Third-place match winner probability Includes AI probability, score 1-1, xG 1.18-1.18, odds status and lineup context.
Final
Argentina vs Spain World Cup final score and xg angle Includes AI probability, score 1-1, xG 1.07-1.29, odds status and lineup context.
Third place
England vs France Third-place match score and xg angle Includes AI probability, score 1-1, xG 1.18-1.18, odds status and lineup context.
Sorted by champion probability by default. Click table headers to sort.
| Team | Group | Avg Pts | R32 | R16 | QF | SF | Final | Champion |
|---|
Pre-match win, draw, loss, and expected-goal probabilities from the platform forecast.
| Date | Group | Fixture | Host | Expected Goals | Team 1 Win | Draw | Team 2 Win |
|---|
Scoreline distribution based on expected goals with a low-score correction for tighter football matches.
| Date | Group | Fixture | Expected Goals | Most Likely Score | Top 5 Scores | Over 2.5 | BTTS |
|---|
Completed final scores compared with pre-match probabilities and scoreline projections.
| Date | Group | Fixture | Final Score | Predicted Lean | Actual Result | Confidence | Pred Goals | Actual Goals | Over 2.5 | BTTS | Check |
|---|
Match-center lineups, substitutes, and player event stats for completed or published fixtures.
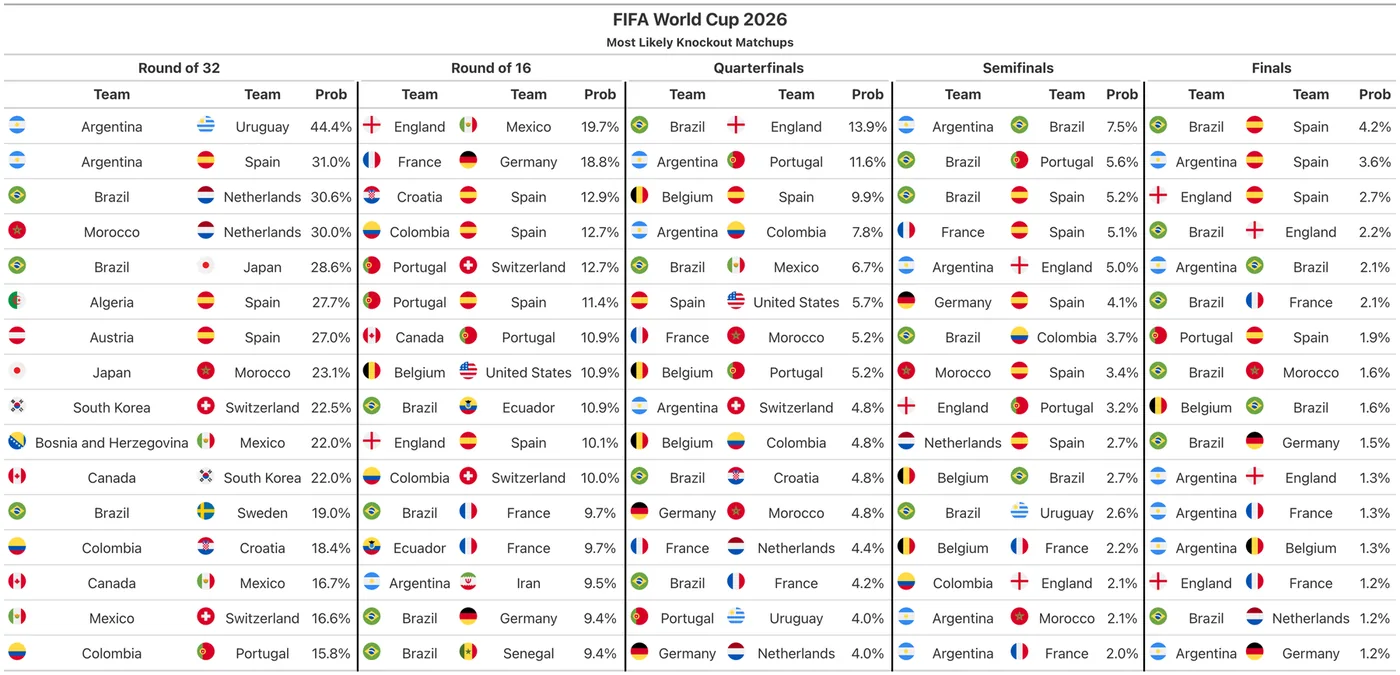
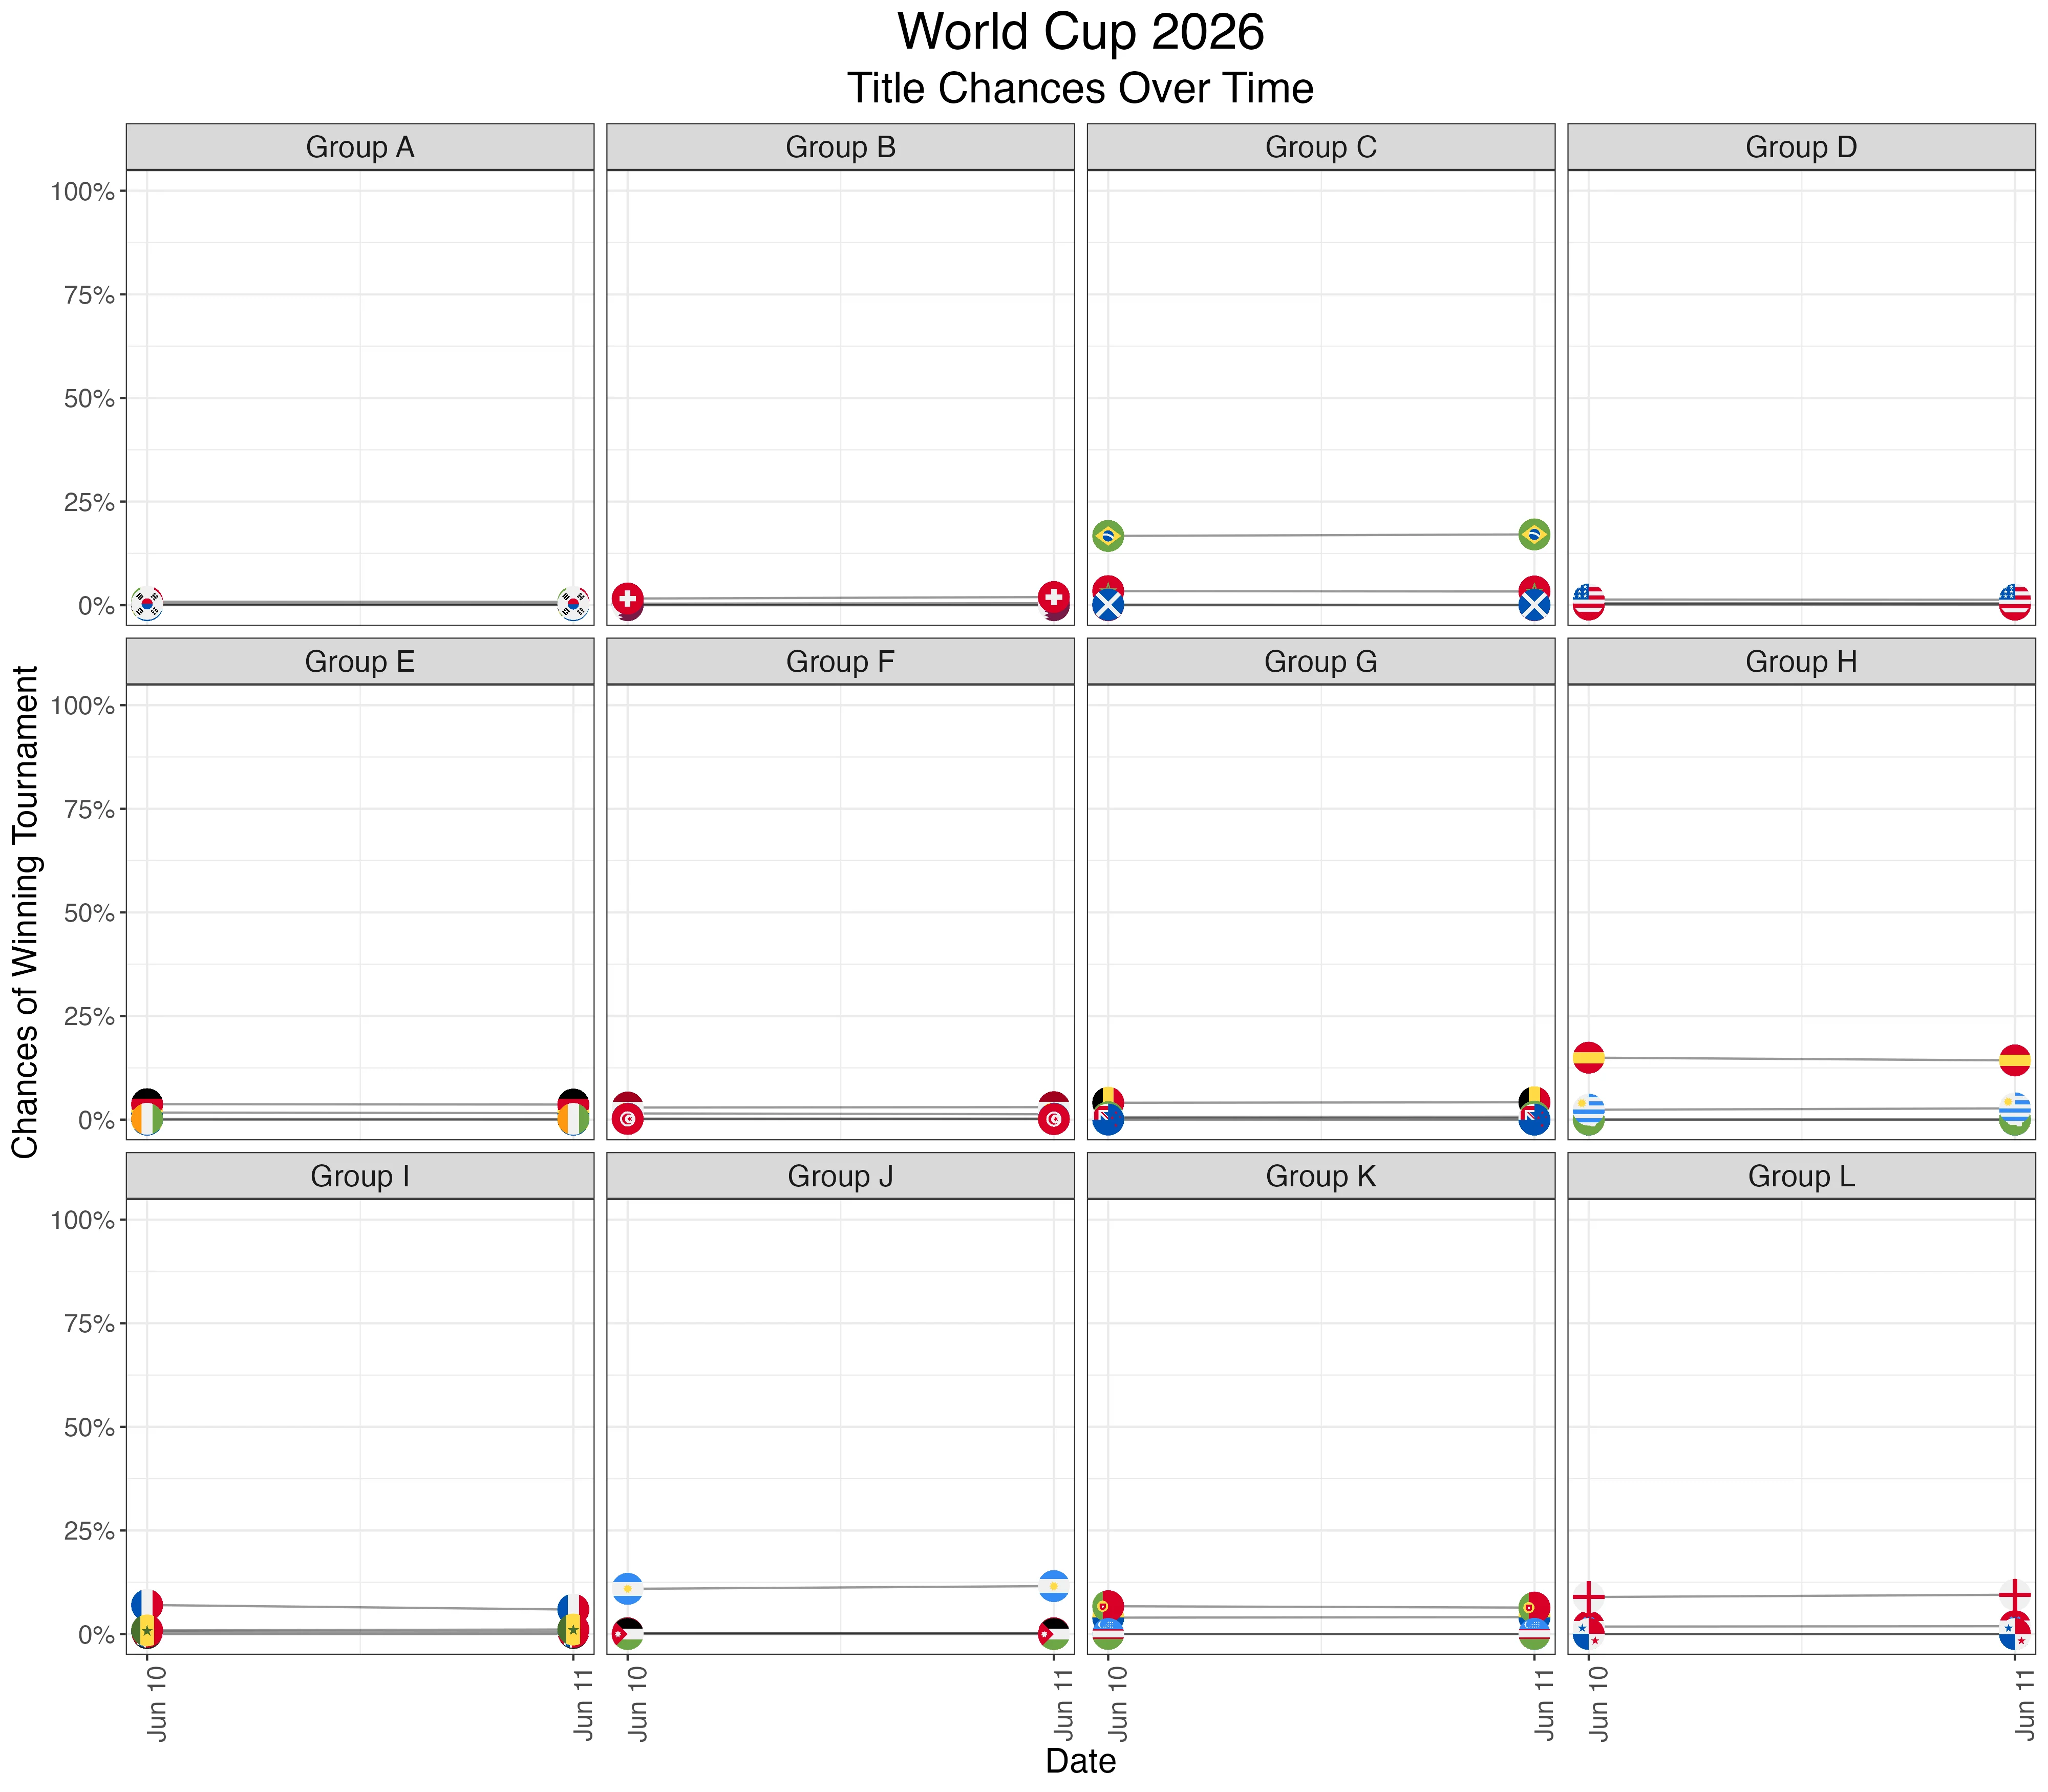
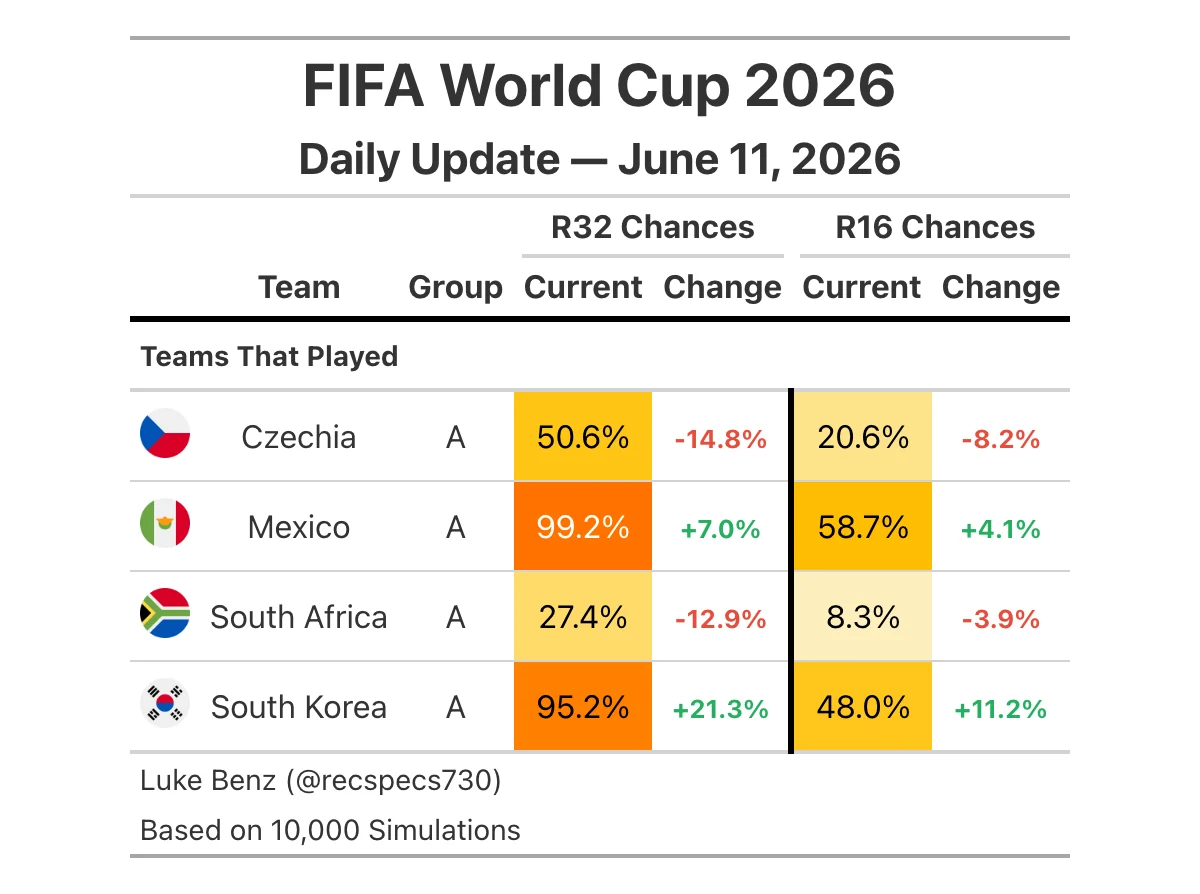
Visual snapshots for tournament probabilities, knockout paths, and daily forecast movement.
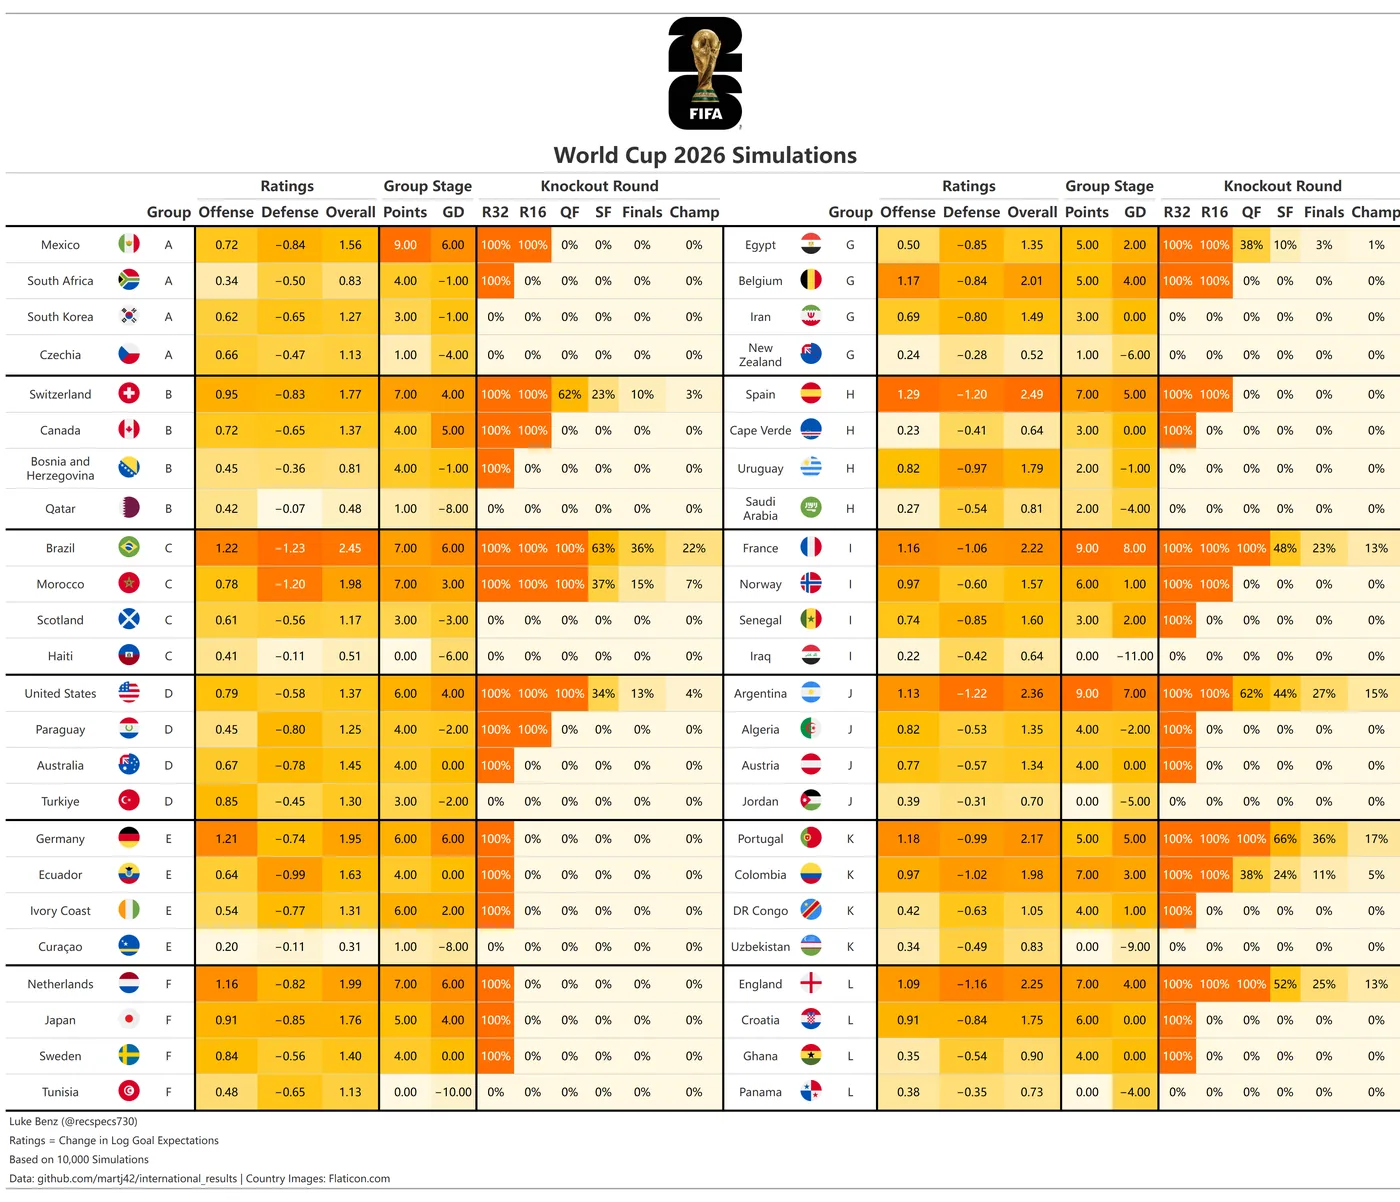
Group A-L simulation tables.
This site is a 2026 World Cup data-analysis tool. It combines pre-match model probabilities, score distributions, group context, completed-match backtesting, and public match-center lineup data into readable pre-match and post-match analysis.